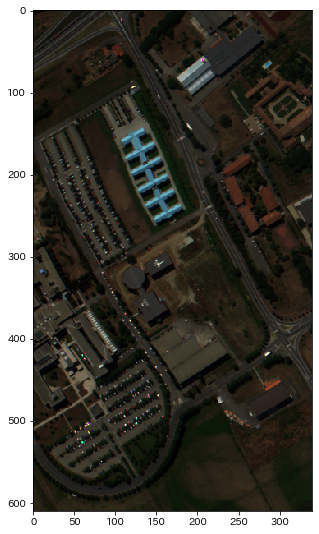
ハイパースペクトルイメージをサポートベクターマシンでクラス分類
ハイパースペクトルイメージ(HSI)の各ピクセルごとのスペクトル情報から機械学習でクラス分類させます。
ここでは、2次元画像の情報(形状、分布)等は学習に使わず、スペクトル情報のみで学習します。
前回はランダムフォレストを使って分類しましたが、今回はサポートベクターマシン(Support Vector Machine, SVM)を使って分類します。
↓ランダムフォレストの記事 sjsy.hatenablog.com
動作環境
サンプルHSI (Pavia University)
今回はPavia UniversityのHSIを使用。 www.ehu.eus
【参考】
ディレクトリ構成
.
├── HSI_classification.ipynb # ここにコード書く
└── dataset
    └── PaviaU
        ├── PaviaU.mat
        └── PaviaU_gt.mat
コード
パッケージのインポート
%matplotlib inline
import numpy as np
import scipy
import matplotlib.pyplot as plt

import os
import scipy.io

from sklearn.model_selection import train_test_split
from sklearn import svm
from sklearn import metrics
データの読み込み
data_path = os.path.join(os.getcwd(),'dataset/PaviaU')
# HSIデータ
X = scipy.io.loadmat(os.path.join(data_path, 'PaviaU.mat'))['paviaU']
# ラベルデータ
y =scipy.io.loadmat(os.path.join(data_path, 'PaviaU_gt.mat'))['paviaU_gt']
import spectral

# RGB画像を表示
color_img = spectral.imshow(X,(65,33,13),figsize =(5,5))

前処理
# HSIのプロパティを取得
height = X.shape[0]
width = X.shape[1]
bands =  X.shape[2]
def createPatches(X, y, removeZeroLabels = True):
    height = X.shape[0]
    width = X.shape[1]
    bands =  X.shape[2]

    patchesData = np.zeros((height * width, bands))
    patchesLabels = np.zeros((height * width))
    patchIndex = 0
    max_val = X.max()

    for r in range(height):
        for c in range(width):
            patchesData[patchIndex, :] = X[r, c]/max_val #コントラストを正規化
            patchesLabels[patchIndex] = y[r, c]
            patchIndex = patchIndex + 1
    if removeZeroLabels:
        patchesData = patchesData[patchesLabels>0,:]
        patchesLabels = patchesLabels[patchesLabels>0]
        patchesLabels -= 1
    return patchesData, patchesLabels
# 2次元画像を1次元ベクトルに変換
XPatches, yPatches = createPatches(X, y)
# 訓練用データとテスト用データに分割
testRatio = 0.5
X_train, X_test, y_train, y_test = train_test_split(XPatches, yPatches, test_size=testRatio, random_state=0,stratify=yPatches)
学習
# 分類器はSVC
# オプションは全部デフォルトで
clf = svm.SVC()
clf.fit(X_train, y_train)
出力
SVC(C=1.0, cache_size=200, class_weight=None, coef0=0.0, decision_function_shape='ovr', degree=3, gamma='auto_deprecated', kernel='rbf', max_iter=-1, probability=False, random_state=None, shrinking=True, tol=0.001, verbose=False)
評価
pre = clf.predict(X_test)
ac_score = metrics.accuracy_score(y_test, pre)
print('正解率:{0:.1f}%'.format(ac_score * 100))
出力
正解率74.5%
あまり学習ができていなさそうです。
混同行列(Confusion Matrix)で確認しましょう。
import pandas as pd
import seaborn as sns
from sklearn.metrics import confusion_matrix
import matplotlib.pyplot as plt

class_name = ['Asphalt', 'Meadows', 'Gravel',
              'Trees', 'Painted metal sheets', 'Bare Soil',
              'Bitumen', 'Self-Blocking Bricks','Shadows']


labels = sorted(list(set(y_test)))
cmx_data = confusion_matrix(y_test, pre, labels=labels)
df_cmx = pd.DataFrame(cmx_data, index=class_name, columns=class_name)

plt.figure(figsize = (10,7))
sns.heatmap(df_cmx, annot=True)
plt.ylim(9,0)
plt.show()
 GravelとBitumenの分類が学習できていないようです。
パラメータチューニング
SVMのデフォルトで設定していたパラメータを、scikit-learnのGridSearchCVを使ってハイパーパラメータ探索をしていきます。
from sklearn.model_selection import GridSearchCV

# 探索するパラメータを設定
parameters = {
    'C':np.logspace(-1, 3, 5),
    'kernel': ['rbf', 'linear'],
    'gamma':np.logspace(-1, 3, 5)
}

# GridSearch
# cv:交差検証(Cross-validation)の分割数
# verbose:プログレスバーの表示
clf = GridSearchCV(svm.SVC(), parameters, cv=4, verbose=3)
clf.fit(X_train, y_train)

# スコアが最も高かったパラメータを表示
clf.best_estimator_
出力
SVC(C=10.0, cache_size=200, class_weight=None, coef0=0.0, decision_function_shape='ovr', degree=3, gamma=10.0, kernel='rbf', max_iter=-1, probability=False, random_state=None, shrinking=True, tol=0.001, verbose=False)
ベストのパラメータでの評価
pre = clf.best_estimator_.predict(X_test)
ac_score = metrics.accuracy_score(y_test, pre)
print('正解率{0:.1f}%'.format(ac_score * 100))
出力
正解率95.9%
正解率が上がりました。
混同行列(Confusion Matrix)を確認しましょう。
cmx_data = confusion_matrix(y_test, pre, labels=labels)
df_cmx = pd.DataFrame(cmx_data, index=class_name, columns=class_name)

plt.figure(figsize = (10,7))
sns.heatmap(df_cmx, annot=True)
plt.ylim(9,0)
plt.show()

分類の結果を画像で表示
# 画像の用意
outputs = np.zeros((height,width))
index =0
for i in range(height):
    for j in range(width):
        target = y[i,j]
        if target == 0 :
            continue
        else :
            prediction = clf.predict(XPatches[index].reshape(1,-1))
            outputs[i,j] = prediction+1
        index += 1
# 正解画像
ground_truth = spectral.imshow(classes = y,figsize =(10,10))
# 機械学習画像
predict_image = spectral.imshow(classes = outputs.astype(int),figsize =(10,10))
正解画像

機械学習画像

大まかに分類できている様子がわかります。
まとめ
HSIをSVCで分類しました。 ハイパーパラメータ探索をして、正解率が向上しました。
結果をみると大まかには分類できているようです。
次回は、XGboosやってみます。